UCLA Tuition & Fees Breakdown and Student Loan Debt Overview
Graph Set 1: Breakdown of Tuition and Fees (1979-2014)
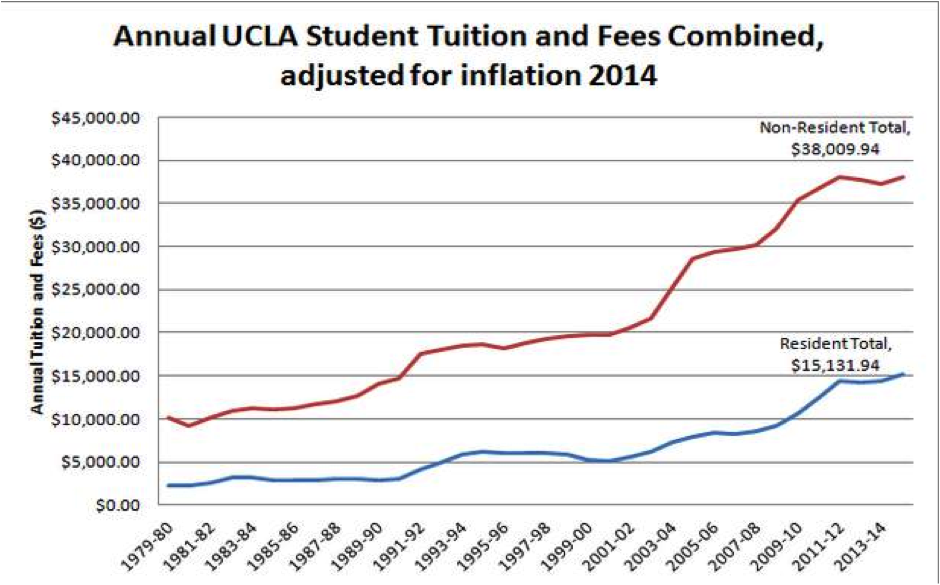
Figure 1
Data retrieved from: http://www.registrar.ucla.edu/archive/
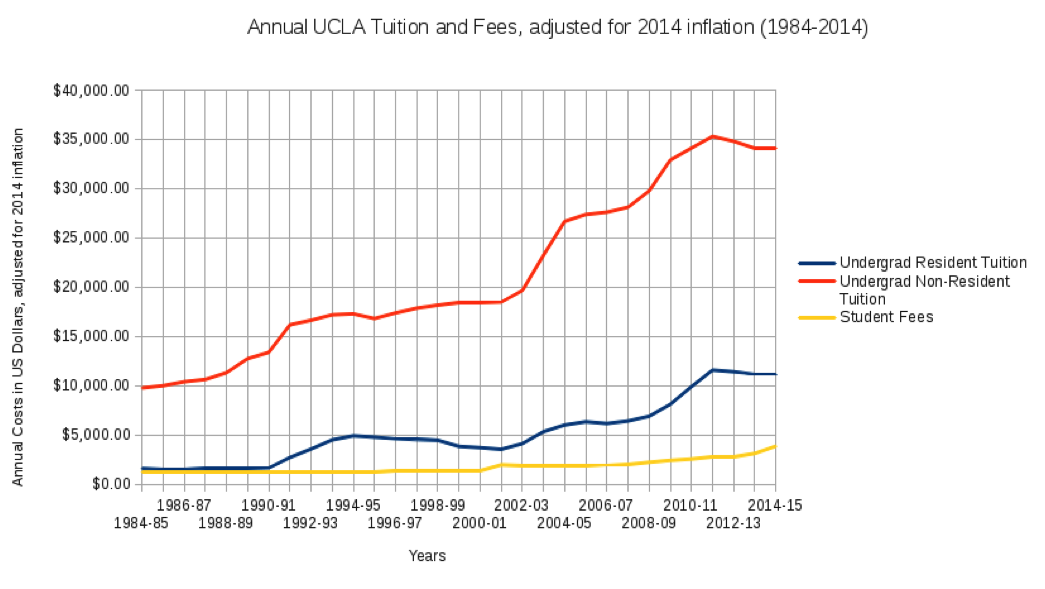
Figure 2
Data retrieved from: http://www.registrar.ucla.edu/archive/
This first graph compares the long-term tuition and fees increase for both resident with that of non-resident undergraduate students. Non-residents pay about two and a half times more tuition and fees than residents.
The second graph, on the other hand, provides a more detailed breakdown of what students have to pay as “tuition” and as “student fees”. It is interesting to note that until 2011, about right in the midst of large tuition hikes, “tuition” used to be called “educational fee”; perhaps the UC changed this term so as a better describe the reality of how much students have to pay for a UC education. “Student fees” include non-tuition costs like the $123.99 fee for the UCLA undergraduate student government (USAC) or the $51 fee to access the Wooden Center’s gym. Most of student fees, however, is made up of the UC Student Health Insurance Plan (UCSHIP), which is $1,938 for the 2014-15 academic year. Almost all of the student fee increase between 2000 and 2014 has been from increases in this student health insurance plan.
The graphs indicate a distinct tuition hike pattern in which short, drastic increases are followed by longer periods of relative tuition freezes. Although students have organized anti-tuition protests during tuition increases, many of these activists later graduate during the calmer periods of tuition freezes. As a result, student activists constantly lose organizing experience and historical memory as more veteran activists graduate. In the net gain, the UC Regents has successfully increased student tuition since 1979 even though tuition increases are deeply unpopular with the California public and students.
Graph Set 2: Overview of Tuition & Fee Increases (1979-2020)
Data retrieved from: http://www.registrar.ucla.edu/archive/
Data retrieved from: http://www.registrar.ucla.edu/archive/
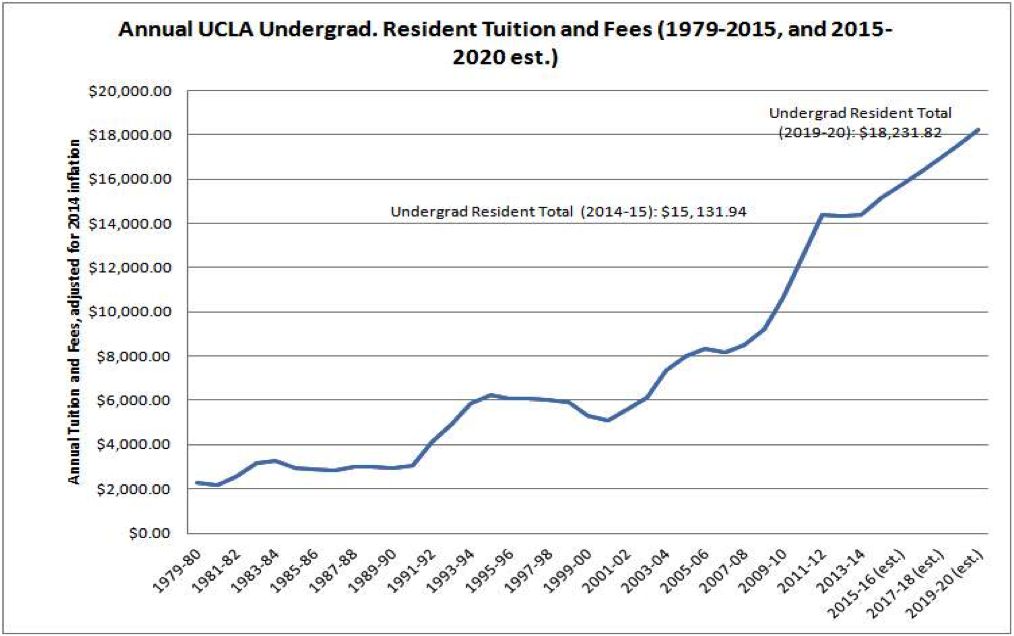
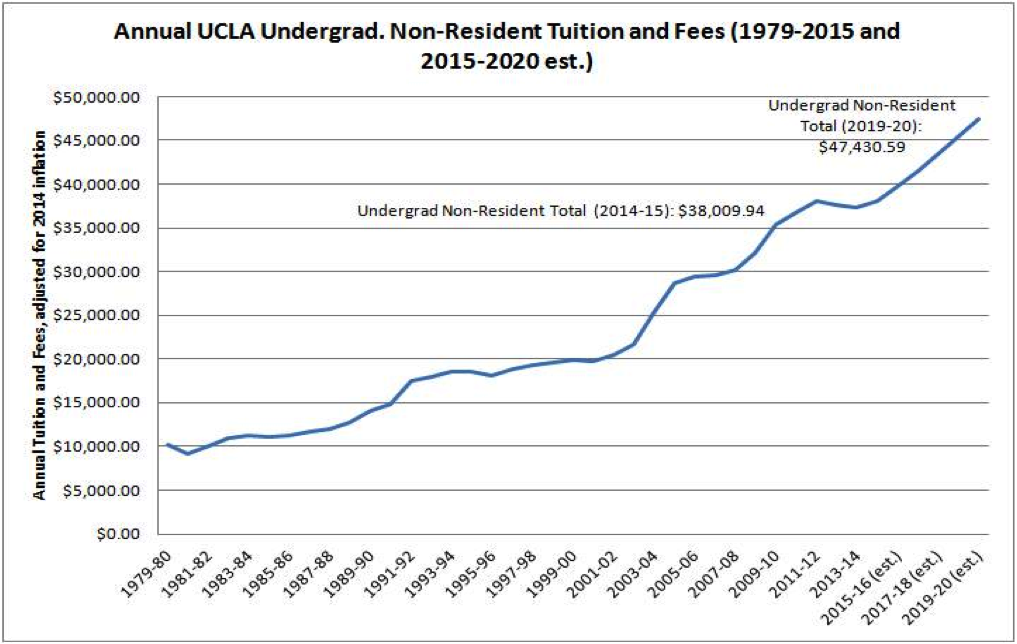
The two graphs provide a more detailed trend of tuition increases between in-state students and out-of-state undergraduate students. These two more clearly show the “tuition hike” and “tuition freeze” periods. The graphs also estimate tuition and fee increases of 2015-2020 according to the UC Regent’s proposed 5% tuition each year for five years, a gradual 27.8% increase.
For in-state undergraduate students, periods of “tuition hikes” include 1981-1984, 1990-1994, 2000-2006, and 2008-2011. 2015-2020 would be the most recent “tuition hike” years if the UC Regents had their way with increasing tuition.
According to the UC Office of President 2015-16 Budget Report, tuition and fees increased 92% during the recession of the early 1980s, 134% in the early 1990s, 79% in the early 2000s, and 99% beginning in 2007-08 through 2011-12. Student tuition would increase about 27.8% from 2015-2020 if the UC goes through with their approved budget plan.
For in-state undergraduate students, tuition and fees increased 557% from 1979-2014.
For out-of-state undergraduate students, tuition and fees increased 273% from 1979-2014.
UCLA graduate students experienced similar tuition increases.
For in-state graduate students, tuition and fees increased 538% from 1979-2014.
For out-of-state graduate students, tuition and fees increased 198% from 1979-2014.
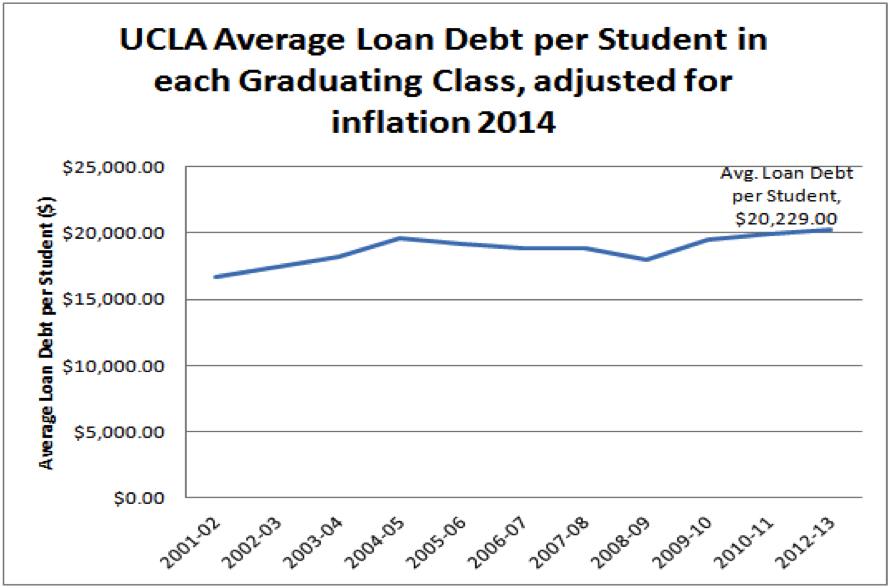
Graph Set 3: UCLA Undergraduate Student Loan Debt (2001-2013)
Data retrieved from: https://drive.google.com/file/d/0B6qweGj-VVGzQnlfa01SVTc4bVE/view?usp=sharing
The graph shows the loan debt per student in each graduating class. In 2001, the earliest data available, the average loan debt was about $16,745 per student. In the 2013 graduating class, the most recent data available, average student loan debt was about $20,229 per student. About 49% of graduating students graduated with loans in 2013. Between 2001-2013, the percent of students who graduated with loan debt remained relatively constant, fluctuating between 45% and 50%.
Between 2001 and 2013, average loan debt per student increased by 21%. As tuition has increased since 2001, students have also taken out more student loans.
Between 2001 and 2013, average loan debt per student increased by 21%. As tuition has increased since 2001, students have also taken out more student loans.
Composed by: Todd Lu, UCLA undergrad from Student collective against labor exploitation (SCALE)
